Overview
Description
The Galileo Network Analytics Toolkit is a relatively new project that aims to provide a robust microservices-oriented framework for building network data pipelines specifically tailored for cybersecurity operations. Built with modularity and scalability at its core, this toolkit is designed to empower security teams to construct robust threat hunting and anomaly detection stacks that can adapt to evolving security landscapes.
Unix Philosophy
Galileo embraces the core principle of building Unix command-line interfaces (CLI): create small, focused programs that do one thing well and can be combined to accomplish more complex tasks. This philosophy, known as the Unix philosophy, emphasizes modularity, simplicity, and the use of text streams as a universal interface. By applying these principles to cybersecurity analytics, Galileo allows teams to build sophisticated solutions from composable, single-purpose commandline clients that can be orchestrated together to create powerful workflows. This approach enables high availability, fault tolerance, and the ability to integrate seamlessly with existing security infrastructure while maintaining operational efficiency.
Use Cases
Galileo is particularly well-suited for security operations centers (SOCs), managed security service providers (MSSPs), and security teams looking to enhance their threat detection capabilities. The stack supports near real-time monitoring, historical data analysis, and proactive threat hunting initiatives, making it valuable for both reactive and proactive security measures.
Concept of Operations
GNAT consists of a series of command line clients that work together to capture, generate, process, and analyze network flow streams.
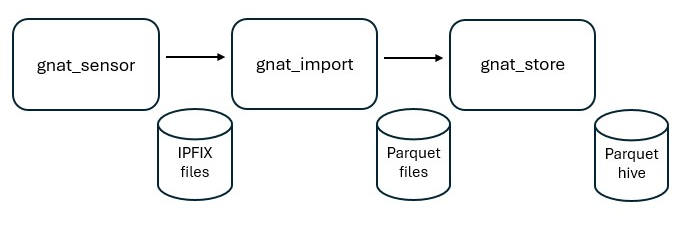
The pipeline is consists of a chain of clients operating on file-based streams of data that, first, ingests IPFIX files from gnat_flow,
then pumps the streams through the various stages in Apache Parquet format. The pipeline clients are designed to be modular
and configurable using Docker Compose, allowing users to customize the flow of stream(s) based on their use case.
The diagram above illustrates the flow of data through the pipeline, from the sensor to the final output of daily collection of flow records.
Enabling Technologies
Designed to be fast, flexible, and efficient, the toolkit is built on a foundation of open-source technologies:
- Rust: The core language for building Galileo, providing performance and safety.
- YAF: A fast, lightweight flowmeter used for flow generation and processing.
- nDPI: A deep packet inspection library for protocol identification.
- DuckDB: An embedded analytics database engine for efficient processing and querying.
- Parquet: A columnar storage format for efficient data storage and retrieval.
- Docker: For containerization for simple deployment of Galileo components.
Toolkit Components
1) Core Tools
- gnat_flow: a high-performance network flow meter for capturing and generating flow records.
- gnat_import: import and transform IPFIX streams into Parquet streams.
- gnat_split: split flow streams into more than one based on
proto. - gnat_merge: merge flow streams based on
protostream into one. - gnat_export: export flow streams into a different format, i.e. CSV and JSON.
- gnat_store: for storing flow streams as data, locally or in the cloud.
2) Annotation & Notification
- gnat_tag: annotates (labels) the streams of flow data with tags.
- gnat_rule: rule engine for triggering alerts and notifications on flow data.
3) Enrichment Tools
- gnat_geoip: enriches flow data with geographic information based on IP addresses.
- gnat_reputation: enriches flow data with IP reputation scores and threat intelligence.
4) Anomaly Detection Tools
- gnat_hbos: anomaly detection using the Histogram-based Outlier Score (HBOS) algorithm.
- gnat_hbos_model: generates histogram models for
gnat_hbosusing sample data. - gnat_iforest: anomaly detection using Extended Isolation Forest (EIF) for complex multi-dimensional patterns.
- gnat_iforest_model: trains Extended Isolation Forest models for
gnat_iforest. - gnat_sample: samples and generates baseline data for unsupervised training.
5) Caching & Storage
- gnat_cache: caches flow data in a local DuckDB database for fast querying.
Use Cases
The toolkit is designed to be simple and flexible, allowing it to be adapted for various use cases in network traffic analysis.
- Network Monitoring: Track and analyze network traffic in real-time.
- Flow Analysis: Gain insights into flow patterns and behaviors.
- Data Export: Export flow data for further analysis or reporting.
- Data Import: Import flow data from various sources for analysis.
- Data Storage: Store flow data in a structured format for easy querying and analysis.
- Data Visualization: Visualize network flows and patterns using third-party tools.
- Security Analysis: Analyze network traffic for security threats and anomalies.
- Performance Monitoring: Monitor network performance metrics and identify bottlenecks.
- Data Enrichment: Enrich flow data with additional metadata for deeper analysis.
- Data Retention: Manage data retention policies for compliance and storage efficiency.
- Real-time Alerts: Set up alerts for specific network events, triggers, or anomalies.
- Historical Analysis: Analyze historical flow data for trends and patterns.
- Data Transformation: Transform flow data into various formats for compatibility.
Integrations
- Motherduck: For data storage and management.
- SuperSet: For data visualization.
- Grafana: For visualizing flow data and creating dashboards.
- OpenSearch: For indexing and searching flow data.
- Apache Kafka: For real-time data streaming and processing.
- FluentBit: For log aggregation and data collection.
- Grafana Loki: For log aggregation and visualization.
- Granfa Alloy: For collecting logs and sending them to Grafana Loki.
- ClickHouse: For high-performance analytics and data warehousing.